It’s Tuesday afternoon, and the finance team is still wrestling with those month-end CargoWise reports. Again. Hours spent exporting, tweaking formulas in Excel, and praying for no typos. Meanwhile, the ops guys are making decisions based on gut feel, because by the time finance spits out the actual numbers, the window for impactful action has slammed shut.
This isn’t a new horror story; it’s just the modern reality for too many outfits running complex logistics operations on platforms like CargoWise. The promise of having tons of data is one thing, but actually doing something with it, in time to matter? That’s another beast entirely.
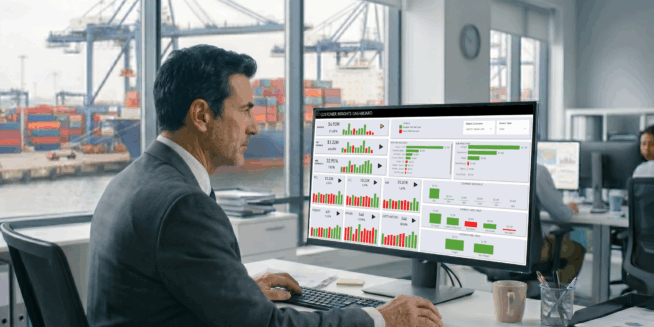
Now, the PR machines are humming about how CargoWise BI dashboards are the silver bullet. They’re supposed to transform all that raw data – the bookings, the costs, the timelines, the endless financial records – into something you can actually, you know, see. Something that doesn’t require a degree in advanced spreadsheet-fu to decipher.
Why the Sudden Urgency for Shiny Dashboards?
Look, the logistics game has always been about speed and precision, but it’s gotten even more brutal. Supply chains are a mess, customers want to know where their stuff is right now, and if you’re juggling multiple warehouses or international routes, you need eyes everywhere. Complaining about supply chain disruptions is so last year; adapting is the name of the game. And if your critical information is locked away in static reports that take days to generate, you’re not adapting, you’re just… existing.
This environment means any delay in understanding performance—whether it’s a bottleneck in customs or an unexpected spike in demurrage charges—can translate directly into lost revenue. Opportunities get missed, costs spiral, and customer satisfaction takes a nosedive. It’s not about having data anymore; it’s about having immediate clarity. The kind that lets you pounce on an issue before it becomes a crisis.
Is CargoWise Data Really That Hard to Use?
CargoWise itself is a beast of a system. It’s designed to manage the whole darn lifecycle of a shipment, from the first booking to the final invoice. It captures an incredible amount of detail. The problem isn’t the system’s capability; it’s how that capability translates into usable insights for the people who need to make decisions today. You see, data is often fragmented across different modules—operations, finance, warehousing. Each part works fine, but getting a holistic view? That requires some serious elbow grease. And let’s not even start on the ‘real-time’ aspect, which for many CargoWise users still means ‘yesterday afternoon’s export’.
When you’re spending hours manually pulling reports, cleaning data in Excel, and then trying to stitch together financial performance with operational movements, you’re not making decisions. You’re just building a historical document. And often, different teams end up with slightly different versions of that document, leading to… well, more arguments than insights.
“By the time clarity is achieved, the moment to act has often passed.”
This is the core pain point. The lag time. By the time someone finally gets a handle on the numbers, the situation has likely evolved, rendering the ‘insights’ about as useful as a weather report from last week.
So, What Exactly Are These Dashboards?
Think of them as a translator. They don’t replace CargoWise; that’s the first thing to understand. They take the complex language CargoWise speaks—all those fields, codes, and transactions—and turn it into something visually digestible. Instead of drowning in rows and columns, you get charts, graphs, and key performance indicators that pop. The goal is to consolidate data from those disparate modules into a single, coherent view. Near real-time updates mean you’re not looking backward, but at what’s happening now. If you need to dig into a specific shipment that’s flagged as problematic, a good BI dashboard lets you drill down, right there on the screen.
This isn’t magic; it’s just better presentation. It’s about making the information already trapped within CargoWise accessible and actionable without the manual drudgery. Suddenly, understanding profitability isn’t a multi-day ordeal linking finance to operations; it’s a quick glance at a dashboard.
The Bottom Line: Who’s Making Money Here?
Ultimately, this is about competitive advantage. In a world where every percentage point of efficiency matters and customer demands are only going to get louder, the companies that can react fastest will win. CargoWise BI dashboards promise to equip those companies with the speed they need. The vendors selling these dashboards? They’re making money by selling a solution to a problem created, in part, by the very complexity of systems like CargoWise. It’s a classic tech play: build a powerful, complex system, then sell add-ons that make it easier to use the data you’re already collecting.
Will it revolutionize the industry? Probably not. But will it stop finance teams from spending their Tuesdays in Excel hell and give ops managers the visibility they desperately need? If the dashboards are well-built and integrated properly, then yes. And in this business, that’s often enough to make a real difference.
🧬 Related Insights
- Read more: [AI] Delivery Fleets Find Hidden Capacity. Here’s How.
- Read more: Maersk’s Panama Port Grab Sparks Epic Arbitration Clash with CK Hutchison
Frequently Asked Questions
What does a CargoWise BI dashboard actually do?
A CargoWise BI dashboard pulls data from various modules within the CargoWise system (like operations, finance, and warehousing) and presents it in a visually understandable format, such as charts and graphs. This allows users to quickly gain insights into their logistics operations and financial performance without manual data compilation.
Will I still need CargoWise if I use a BI dashboard?
Yes, you will absolutely still need CargoWise. BI dashboards are designed to enhance and visualize the data already stored within CargoWise; they do not replace the core functionality of the logistics management system itself.
How quickly can I see real-time data with a BI dashboard?
Many BI dashboards offer near real-time data updates, meaning the information displayed is very current, often updated within minutes or seconds. The exact ‘real-time’ capability can vary depending on the specific dashboard solution and its integration with CargoWise.